In the first five articles in this series, I built AI features that could review a seller listing, run with cloud or local models, evaluate model candidates, enrich book metadata with external evidence, and extract a shoe colorway from product images.
At that point, the application could retry a transient failure, open a circuit breaker, and move from a primary model to a fallback model. But I still could not answer some basic production questions:
- How many feature requests return a valid result?
- How long does the complete feature take, including catalog lookup, image download, validation, retry, and fallback?
- Which model and route are causing the latency?
- How often does fallback activate, and why?
- How many model calls does one seller request create?
- How many input and output tokens are we using?
- What is the approximate cloud-model cost?
- Can I move from a failed HTTP request to the relevant model call in one trace?
HTTP status, application logs, and provider dashboards each show part of the answer. None of them describes the complete feature.
For this article, I added an opt-in observability profile to both Spring Boot applications in the project:
- the Seller Listing Quality API on port 8080
- the book and shoe Enrichment API on port 8081
Spring AI continues to produce model latency, token usage, and model-call observations. The application adds a small business telemetry layer for feature outcomes, fallback decisions, and route failures. Prometheus stores the metrics, Tempo stores the traces, and Grafana provisions a complete dashboard from version-controlled files.
TL;DR – SmtC
Too Long; Didn’t Read – Show me the Code: https://github.com/iseif/listing-quality
This continues the same project from the first five articles:
- Build a Seller Listing Quality API
- Run Spring AI with Local LLMs
- Do You Need a Frontier Model?
- Build a Grounded Catalog Enricher
- Build a Multimodal Shoe Color Enricher
HTTP 200 is not an AI feature SLO
An HTTP request can succeed while the feature still produces a degraded result.
The book enricher may return NEEDS_SELLER_INPUT because no safely grounded proposal was available. The shoe endpoint may return the same status because neither model found a usable retail exterior. Both are valid, safe responses. They should not be counted as infrastructure failures.
The opposite can happen too. A provider may return HTTP 200 with JSON that passes schema validation but fails the application evidence rules. That is a model-route failure, even though the provider request itself succeeded.
So I separate three levels:
| Level | Question | Source |
|---|---|---|
| HTTP | Did the API transport succeed? | Spring MVC and Actuator |
| AI operation | Which provider and model ran, for how long, with how many tokens? | Spring AI |
| Feature | Did the complete use case return a safe result, through which route, and with which domain outcome? | Application observation |
This distinction also affects latency. The model timer does not include Google Books, product image loading, validation, comparison, or fallback selection. The feature timer must wrap the whole use case if it is going to support a useful SLO.
Keep framework telemetry and business telemetry separate
Spring AI observability already records the gen_ai.client.operation observation around model calls. It also publishes gen_ai.client.token.usage when token usage is available.
That gives us provider and model details without writing another model timer. It also avoids coupling business code to OpenAI, Gemini, or an OpenAI-compatible local server.
The application only adds information Spring AI cannot know:
feature:listing-review,book-enrichment, orshoe-color-enrichmentroute:direct,primary,fallback, ornoneresult:successorfailureoutcome: a bounded domain status or failure category- fallback count and reason
- route failure count and category
The result is one trace with nested responsibilities:
HTTP request
  listing.quality.ai.feature
    listing.quality.ai.route (primary)
      Spring AI chat client and advisor spans
        gen_ai.client.operation
        optional tool and outbound provider HTTP spans
    optional listing.quality.ai.route (fallback)
      Spring AI chat client and advisor spans
        gen_ai.client.operation
The feature observation owns the business outcome. A route observation owns one primary or fallback attempt. Spring AI owns model telemetry. Resilience4j owns retry and circuit state. Book catalog calls made as model tools appear below the relevant Spring AI spans.
Two things deliberately have no span of their own. Application validation runs inside the route observation, so its time is included in the route span without adding a level to the tree. Shoe image loading stays inside the feature latency, because the current java.net.http.HttpClient loader is not instrumented. Both are honest omissions rather than gaps I expect a reader to discover in Tempo. Each remaining layer has one reason to change.
Add an opt-in observability profile
I added Prometheus and OpenTelemetry support to both application modules:
<dependency>
  <groupId>io.micrometer</groupId>
  <artifactId>micrometer-registry-prometheus</artifactId>
</dependency>
<dependency>
  <groupId>org.springframework.boot</groupId>
  <artifactId>spring-boot-starter-opentelemetry</artifactId>
</dependency>
The enrichment module also adds the Micrometer integration for its existing Resilience4j 2.4.0 routes:
<dependency>
  <groupId>io.github.resilience4j</groupId>
  <artifactId>resilience4j-micrometer</artifactId>
  <version>${resilience4j.version}</version>
</dependency>
Spring Boot manages the Micrometer and OpenTelemetry versions. I do not add a second version property for libraries already controlled by the Boot dependency management.
The interesting question is what belongs in the default configuration and what belongs behind a profile. My first version put all of it behind the profile, and that turned out to be the wrong line.
Collecting metrics costs nothing until something asks for them. Prometheus is pull-based, so an unscraped endpoint does no work. Exporting traces is different: it needs a collector to exist, and when one does not, the exporter fails and fills the log. Only the second one is a real decision.
So metric collection and the Prometheus endpoint are part of the default configuration in both applications:
management:
  endpoints:
    web:
      exposure:
        include: health, info, metrics, prometheus
  metrics:
    distribution:
      percentiles-histogram:
        http.server.requests: true
        gen_ai.client.operation: true
        listing.quality.ai.feature: true
        listing.quality.ai.route: true
  opentelemetry:
    tracing:
      export:
        otlp:
          enabled: false
  otlp:
    metrics:
      export:
        enabled: false
This tutorial uses Prometheus for metrics and OTLP for traces, so OTLP metrics export is explicitly disabled. Without that line, the OpenTelemetry starter also creates an OTLP metric exporter and the application attempts to push metrics in addition to exposing the Prometheus endpoint.
The profile then adds the one capability that depends on another system:
management:
  tracing:
    sampling:
      probability: ${OBSERVABILITY_TRACING_SAMPLING_PROBABILITY:1.0}
  opentelemetry:
    tracing:
      export:
        otlp:
          enabled: true
          endpoint: ${OTEL_EXPORTER_OTLP_TRACES_ENDPOINT:http://localhost:4318/v1/traces}
We run the services with the new profile to activate it as:
SPRING_PROFILES_ACTIVE=openai,observability \
  ./mvnw -pl listing-quality-service spring-boot:run
The distinction matters more than it looks. The telemetry adapters in this article are ordinary components, so feature observations, route observations, fallback counters, and Resilience4j meters are recorded on every boot regardless of profile. Instrumentation is not the opt-in. Shipping it somewhere is.
Getting this wrong is easy to miss, because the failure is quiet. While the profile also controlled the Prometheus endpoint, an application started without it still looked healthy while returning 404 to every scrape. Nothing failed. The service was simply invisible, which is the one state an observability change should never be able to produce by accident.
The demo samples every trace so a reader can make one request and see it. A production service should choose a lower sampling probability based on traffic, incident needs, and telemetry cost.
Prompt and completion logging remains disabled:
spring:
  ai:
    chat:
      observations:
        log-prompt: false
        log-completion: false
Spring AI keeps both values false by default because prompts and completions may be large and sensitive. This project leaves that safety default in the checked-in configuration.
Wrap the complete use case with one observation
The Listing Quality API has no primary and fallback route inside one process. It switches provider by profile, so its route is always direct.
The telemetry adapter accepts a Supplier<ListingReview>, not the listing itself:
@Component
public final class ListingReviewTelemetry {

  static final String OBSERVATION_NAME = "listing.quality.ai.feature";

  private final ObservationRegistry observationRegistry;

  public ListingReviewTelemetry(ObservationRegistry observationRegistry) {
    this.observationRegistry = Objects.requireNonNull(observationRegistry);
  }

  public ListingReview observe(Supplier<ListingReview> operation) {
    Objects.requireNonNull(operation);
    Observation observation = Observation.createNotStarted(OBSERVATION_NAME, observationRegistry)
        .contextualName("listing review")
        .lowCardinalityKeyValue("feature", "listing-review")
        .lowCardinalityKeyValue("route", "direct")
        .start();
    try (Observation.Scope ignored = observation.openScope()) {
      try {
        ListingReview review = operation.get();
        observation.lowCardinalityKeyValue("result", "success")
            .lowCardinalityKeyValue("outcome", "reviewed");
        return review;
      } catch (RuntimeException | Error failure) {
        observation.error(failure)
            .lowCardinalityKeyValue("result", "failure")
            .lowCardinalityKeyValue("outcome", outcome(failure));
        throw failure;
      }
    } finally {
      observation.stop();
    }
  }
}
ListingReviewService places prompt rendering, model generation, and business validation inside that supplier. If validation rejects the model output, the feature observation records a failure and rethrows the same domain exception. Telemetry does not change the HTTP contract.
The enrichment application uses the same observation name and tags, but it derives the final route and outcome from the typed response:
public BookEnrichmentResponse observeBook(Supplier<BookEnrichmentResponse> operation) {
  return observe(
      EnrichmentFeature.BOOK,
      operation,
      BookEnrichmentResponse::execution,
      response -> tagValue(response.status()));
}

public ShoeColorEnrichmentResponse observeShoeColor(
    Supplier<ShoeColorEnrichmentResponse> operation) {
  return observe(
      EnrichmentFeature.SHOE_COLOR,
      operation,
      ShoeColorEnrichmentResponse::execution,
      response -> tagValue(response.status()));
}
The shared helper records one timer for each complete feature execution:
private <T> T observe(
    EnrichmentFeature feature,
    Supplier<T> operation,
    Function<T, ExecutionMetadata> execution,
    Function<T, String> outcome) {
  Objects.requireNonNull(operation);
  Observation observation = Observation.createNotStarted(OBSERVATION_NAME, observationRegistry)
      .contextualName(feature.tagValue())
      .lowCardinalityKeyValue("feature", feature.tagValue())
      .start();
  try (Observation.Scope ignored = observation.openScope()) {
    try {
      T response = operation.get();
      observation.lowCardinalityKeyValue("route", tagValue(execution.apply(response).route()))
          .lowCardinalityKeyValue("result", "success")
          .lowCardinalityKeyValue("outcome", outcome.apply(response));
      return response;
    } catch (RuntimeException | Error failure) {
      observation.error(failure)
          .lowCardinalityKeyValue("route", "none")
          .lowCardinalityKeyValue("result", "failure")
          .lowCardinalityKeyValue("outcome", failureCategory(failure));
      throw failure;
    }
  } finally {
    observation.stop();
  }
}
A returned NEEDS_SELLER_INPUT is still result=success. It is a safe domain outcome, not an exception. This is why the dashboard can show both technical reliability and product usefulness without forcing them into one number.
The two applications keep small telemetry adapters in their own modules. They share the same observation name and tag contract, but I did not introduce a shared library only to remove a few similar lines. They are independently deployable services with different domain outcomes, and keeping the adapters local is the simpler boundary for now.
Treat metric cardinality as an API contract
Metric labels are stored with every time series. A label that accepts arbitrary values can turn one metric into millions of series.
I treat the label vocabulary as a public contract:
| Label | Allowed source |
|---|---|
feature |
closed EnrichmentFeature enum or fixed listing-review value |
route |
closed execution route or fixed direct/none value |
result |
fixed success/failure value |
outcome |
closed response enum or internally mapped failure category |
reason |
internally mapped failure category or fixed inconclusive value |
The telemetry API never accepts a listing ID, title, prompt, URL, provider message, or exception message as a tag.
Failure classification stays inside the adapter:
private String failureCategory(Throwable failure) {
  return switch (failure) {
    case ModelExecutionException modelFailure -> tagValue(modelFailure.category());
    case CallNotPermittedException _ -> "circuit_open";
    case InvalidBookEnrichmentResponseException _ -> "invalid_grounding";
    case InvalidShoeColorResponseException _ -> "invalid_model_output";
    default -> "unexpected";
  };
}
The original exception is attached to the observation, but its message does not become a Prometheus label. The tests inspect every emitted tag and fail if a representative seller ID or exception message appears.
Count fallback at the decision point
Retry and fallback answer different questions.
A primary route may make two provider attempts because of a transient 503. That is still one route decision. If those attempts fail and the application activates oMLX, that is one fallback.
The failover classes therefore record:
- a route failure where the route is known
- one fallback after eligibility is established and before the fallback call
- an inconclusive shoe fallback with the fixed reason
inconclusive
The counters are small and explicit:
public void recordRouteFailure(
    EnrichmentFeature feature,
    ExecutionRoute route,
    Throwable failure) {
  Counter.builder(ROUTE_FAILURES_COUNTER)
      .tag("feature", Objects.requireNonNull(feature).tagValue())
      .tag("route", tagValue(Objects.requireNonNull(route)))
      .tag("category", failureCategory(Objects.requireNonNull(failure)))
      .register(meterRegistry)
      .increment();
}

public void recordFallback(EnrichmentFeature feature, Throwable primaryFailure) {
  incrementFallback(feature, failureCategory(Objects.requireNonNull(primaryFailure)));
}
This lets the dashboard distinguish provider availability, quota, invalid structured output, invalid grounding, circuit-open, and inconclusive decisions without parsing log messages.
Make every model route visible in the trace
Feature tags tell us the final route. They do not show the failed primary work that caused a fallback. To preserve that history, the enrichment telemetry adapter wraps every route execution:
public <T> T observeRoute(
    EnrichmentFeature feature,
    ExecutionRoute route,
    String provider,
    Supplier<T> operation) {
  Observation observation = Observation.createNotStarted(
          ROUTE_OBSERVATION_NAME, observationRegistry)
      .contextualName(feature.tagValue() + " " + tagValue(route))
      .lowCardinalityKeyValue("feature", feature.tagValue())
      .lowCardinalityKeyValue("route", tagValue(route))
      .lowCardinalityKeyValue("provider", providerTag(provider))
      .start();
  try (Observation.Scope ignored = observation.openScope()) {
    try {
      T result = operation.get();
      observation.lowCardinalityKeyValue("result", "success")
          .lowCardinalityKeyValue("outcome", "accepted");
      return result;
    } catch (RuntimeException | Error failure) {
      observation.error(failure)
          .lowCardinalityKeyValue("result", "failure")
          .lowCardinalityKeyValue("outcome", failureCategory(failure));
      throw failure;
    }
  } finally {
    observation.stop();
  }
}
The supplier contains both the provider call and the application validator. A model response that satisfies the provider schema but violates book grounding or shoe color rules therefore marks that route as failed. If fallback succeeds, Tempo shows a failed primary child followed by an accepted fallback child under one feature span.
Provider labels use another closed vocabulary: gemini, omlx, or unknown. The adapter does not copy an arbitrary provider or model name into this application metric.
Preserve trace context across virtual threads
The enrichment route uses a TimeLimiter and an ExecutorService so a provider call cannot exceed the remaining feature deadline. The executor creates one virtual thread per task.
That boundary matters for tracing. An observation scope is thread-local. If work moves to another thread without context propagation, the Spring AI model span becomes a separate trace instead of a child of the feature span.
Micrometer provides a context-aware wrapper:
@Bean(destroyMethod = "close")
ExecutorService enrichmentExecutor() {
  return ContextExecutorService.wrap(
      Executors.newVirtualThreadPerTaskExecutor(),
      ContextSnapshotFactory.builder().build());
}
I use the current ContextSnapshotFactory overload instead of the deprecated one-argument wrap method. The destroy method closes the wrapper, which delegates shutdown to the virtual-thread executor.
The test registers a known thread-local accessor, submits work through the configured executor, and verifies that the value is visible inside the virtual thread. This is deterministic and does not require Tempo.
Export existing retry and circuit state
The application already had category-specific route IDs such as:
book-gemini-primary
book-omlx-fallback
shoe-color-omlx-primary
shoe-color-gemini-fallback
Those IDs are bounded configuration, so they are safe metric labels. ModelRouteFactory owns one retry registry, one circuit-breaker registry, and one Micrometer binding:
this.retryRegistry = RetryRegistry.of(retryConfig);
this.circuitBreakerRegistry = CircuitBreakerRegistry.of(circuitBreakerConfig);
TaggedRetryMetrics.ofRetryRegistry(retryRegistry)
    .bindTo(Objects.requireNonNull(meterRegistry));
TaggedCircuitBreakerMetrics.ofCircuitBreakerRegistry(circuitBreakerRegistry)
    .bindTo(meterRegistry);
Each route receives its configured Retry and CircuitBreaker:
public ModelRoute create(String routeId, String providerId, Duration timeout) {
  return new ModelRoute(
      providerId,
      timeout,
      retryRegistry.retry(routeId),
      circuitBreakerRegistry.circuitBreaker(routeId),
      executor);
}
This keeps metric registration out of the execution object and binds each registry once. The standard meters include resilience4j_retry_calls_total and resilience4j_circuitbreaker_state.
The observability refactor also removed the old RoutePolicy value object. It duplicated timeout and resilience state already owned by ModelRoute, while ModelRouteFactory owns registry construction and metric binding. Removing that extra abstraction leaves one execution object and one factory instead of two overlapping route representations.
Do not trace the Prometheus scraper
The first live stack test found an observability problem that unit tests did not show.
Prometheus scrapes each application every five seconds. Spring MVC observes that request like any other HTTP request, so Tempo was filling with traces named http get /actuator/prometheus.
The trace pipeline was working, but useful traces were being buried in management noise.
Both applications register this predicate:
@Component
final class ActuatorObservationPredicate implements ObservationPredicate {

  private static final String ACTUATOR_PATH = "/actuator/";

  @Override
  public boolean test(String observationName, Observation.Context context) {
    return !(context instanceof ServerRequestObservationContext serverRequest
        && serverRequest.getCarrier().getRequestURI().startsWith(ACTUATOR_PATH));
  }
}
I originally annotated this with @Profile("observability"), which was a mistake worth naming. An ObservationPredicate filters observations, not only traces, so a profile-scoped predicate makes http.server.requests count scrape traffic in one deployment and ignore it in another. A metric whose meaning depends on which profile is active is worse than no metric. Management traffic is never application traffic, in any environment, so the predicate applies in all of them.
After the change, a bounded Tempo query found zero new Prometheus scrape traces, while a normal application request still produced an HTTP trace. This is a small example of why an observability stack needs live validation. A configuration can be technically correct and still generate low-value telemetry.
Keep request secrets out of HTTP spans
The same live trace inspection exposed a more serious issue. The default outbound HTTP observation stored the complete Google Books URL, including the ISBN search query and API key, in http.url.
Disabling prompt logging was not enough. Tool HTTP clients need their own privacy review. The Google Books client now installs a request observation convention that preserves the useful endpoint identity but drops the complete query string:
final class GoogleBooksClientRequestObservationConvention
    extends DefaultClientRequestObservationConvention {

  @Override
  protected KeyValue requestUri(ClientRequestObservationContext context) {
    if (context.getCarrier() == null) {
      return KeyValue.of("http.url", "none");
    }
    URI requestUri = context.getCarrier().getURI();
    String path = requestUri.getRawPath();
    String sanitizedUrl = requestUri.getScheme()
        + "://"
        + requestUri.getRawAuthority()
        + (path == null || path.isBlank() ? "/" : path);
    return KeyValue.of("http.url", sanitizedUrl);
  }
}
The trace still identifies https://www.googleapis.com/books/v1/volumes, but it cannot reveal a title, ISBN, or API key from the query parameters. A focused regression test constructs a URL containing representative sensitive values and asserts that none reaches the observed tag. Any key that has already reached a trace backend should still be rotated and the affected trace data removed.
Run Prometheus, Tempo, and Grafana with Docker Compose
The Java applications stay on the host. This keeps access to local oMLX simple and lets both model profiles run exactly as they did in the previous articles.
The observability backend runs in Docker:
services:
  prometheus:
    image: prom/prometheus:v3.12.0
  tempo:
    image: grafana/tempo:2.10.5
  grafana:
    image: grafana/grafana:13.1.0
There is no floating latest tag. Tempo 3.0 was still a release candidate when I built this article, so the stack uses the current stable 2.10.5 release.
Prometheus reaches the two host processes through host.docker.internal:
scrape_configs:
  - job_name: listing-quality-service
    metrics_path: /actuator/prometheus
    static_configs:
      - targets:
          - host.docker.internal:8080

  - job_name: listing-quality-enrichment
    metrics_path: /actuator/prometheus
    static_configs:
      - targets:
          - host.docker.internal:8081
Linux compatibility is included with host.docker.internal:host-gateway in Compose.
Start the backend from the repository root:
docker compose -f observability/compose.yaml up -dStart the Listing Quality API with its model profile plus observability:
SPRING_PROFILES_ACTIVE=openai,observability \
  ./mvnw -pl listing-quality-service spring-boot:run
Start the Enrichment API in another terminal:
SPRING_PROFILES_ACTIVE=observability \
  ./mvnw -pl listing-quality-enrichment spring-boot:run
The provider, Google Books, and oMLX environment variables from the previous articles are still required.
The local endpoints are:
| Tool | URL |
|---|---|
| Grafana | http://localhost:3000 |
| Prometheus | http://localhost:9090 |
| Tempo query API | http://localhost:3200 |
| OTLP HTTP receiver | http://localhost:4318/v1/traces |
Grafana uses admin as the local password unless GRAFANA_ADMIN_PASSWORD is set. The stack has no TLS or backend authentication and must not be exposed to an untrusted network.
Provision the dashboard as code
The Grafana data sources and dashboard are files in the repository. They are not manual setup steps.
Grafana provisioning loads Prometheus and Tempo with stable UIDs. The Prometheus data source maps the trace_id exemplar label to Tempo, and the two latency panels explicitly enable exemplars, so a latency point can open its trace. The feature panel queries the raw histogram because Prometheus recording rules do not retain exemplars.
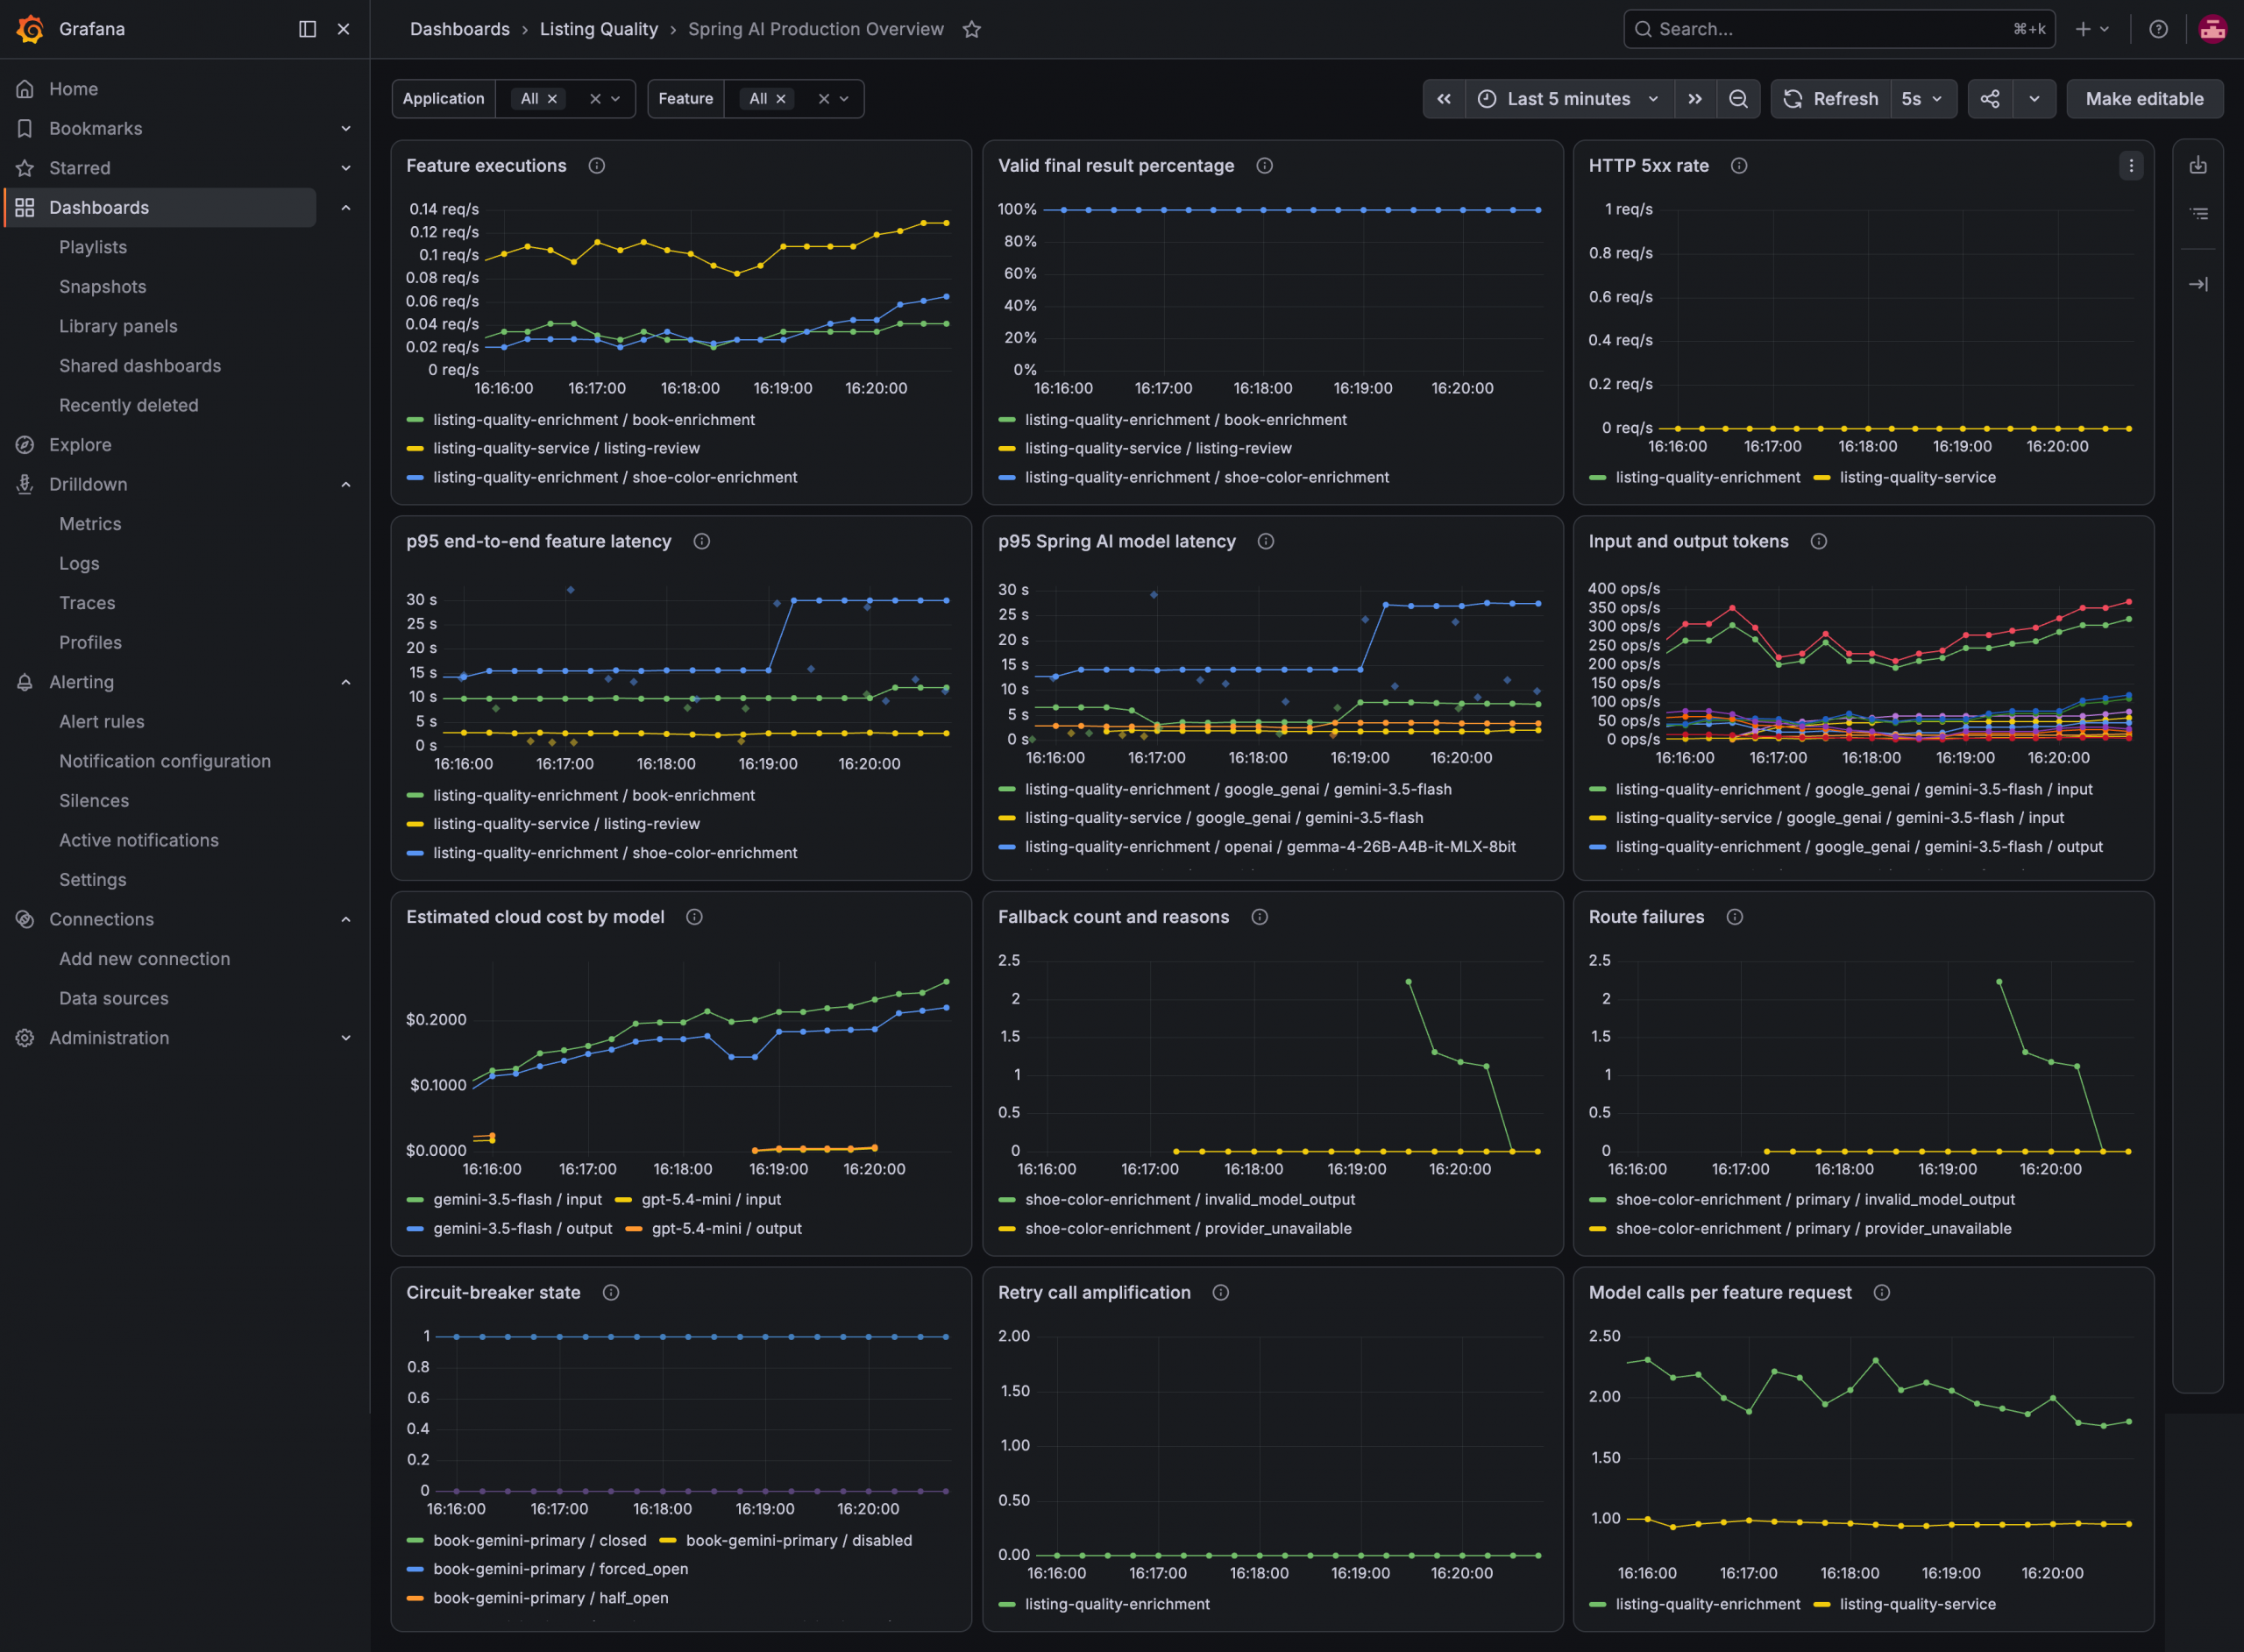 This capture contains a real incident rather than synthetic traffic, and it is the exact case described at the start of this article. The local Gemma route stayed reachable and kept returning schema-valid JSON, but that output failed the application evidence rules, so the shoe feature recorded
 invalid_model_output route failures and activated the Gemini fallback. The provider request succeeded. The model route still failed. Only a feature-level observation can express that difference, which is why the route failure panel separates invalid_model_output from provider_unavailable instead of counting both as one error.
The valid-result ratio stays at 100 percent for the whole window, because the fallback preserved the seller outcome. Meanwhile the local route’s p95 model latency climbs to the configured 30-second primary timeout, so the deadline is visible in telemetry rather than only in configuration.
The amplification panel shows why feature and model telemetry stay separate. The Listing Quality API holds at exactly 1.00 model call per feature request, because it has a single direct route. The Enrichment API runs closer to two, because retry and fallback multiply provider calls behind one unchanged seller request. Both applications served the same kind of traffic; only one of them amplified it.
The diamonds on the two latency panels are exemplars, and each one opens the trace behind that data point.
The checked-in dashboard has application and feature variables plus 12 panels:
- feature executions
- valid final result percentage
- HTTP 5xx rate
- p95 end-to-end feature latency
- p95 Spring AI model latency by provider and model
- input and output tokens by provider and model
- estimated cloud cost by model
- fallback count and reasons
- route failures by feature, route, and category
- circuit-breaker state
- retry call amplification
- model calls per feature request
The two amplification panels are especially useful. A seller sees one API call. The system may execute a provider twice because of retry and then call another model because of fallback. The feature count should remain one while model-call count increases.
The p95 feature query uses the histogram published for listing.quality.ai.feature:
histogram_quantile(
  0.95,
  sum by (job, feature, le) (
    rate(listing_quality_ai_feature_seconds_bucket[5m])
  )
)
The valid-result ratio uses returned feature outcomes, not HTTP status:
sum by (job, feature) (
  rate(listing_quality_ai_feature_seconds_count{result="success"}[5m])
)
/
(
  sum by (job, feature) (
    rate(listing_quality_ai_feature_seconds_count[5m])
  ) > 0
)
The > 0 on the divisor is deliberate, and it replaced a bug I only saw once the dashboard had real traffic.
My first version clamped the divisor to a tiny floor instead, which is a common suggestion for avoiding division by zero. It is the wrong tool here, for three reasons that all showed up on the same screen. An idle feature produced a 0 ratio, so a quiet period looked identical to total failure. The amplification panel divided live model calls by a not-yet-completed feature count and rendered six million model calls for one seller request, because a shoe feature can take most of a 55-second budget to finish while its model calls are already counted. Worst of all, the example valid-result alert compares that ratio against 99 percent, so a clamped zero would have paged someone every quiet night.
Filtering with > 0 drops the sample instead of inventing one. No traffic now produces no data, which is the honest answer, and the alert stays silent when nothing is happening. Absent local-model token series are tolerated the same way, because OpenAI-compatible local servers do not always report usage consistently.
A dashboard that is only ever viewed with synthetic traffic will happily hide arithmetic like this.
Opening an exemplar leads to the corresponding Tempo trace, where the feature, route, Spring AI, model, and outbound provider spans can be inspected together:
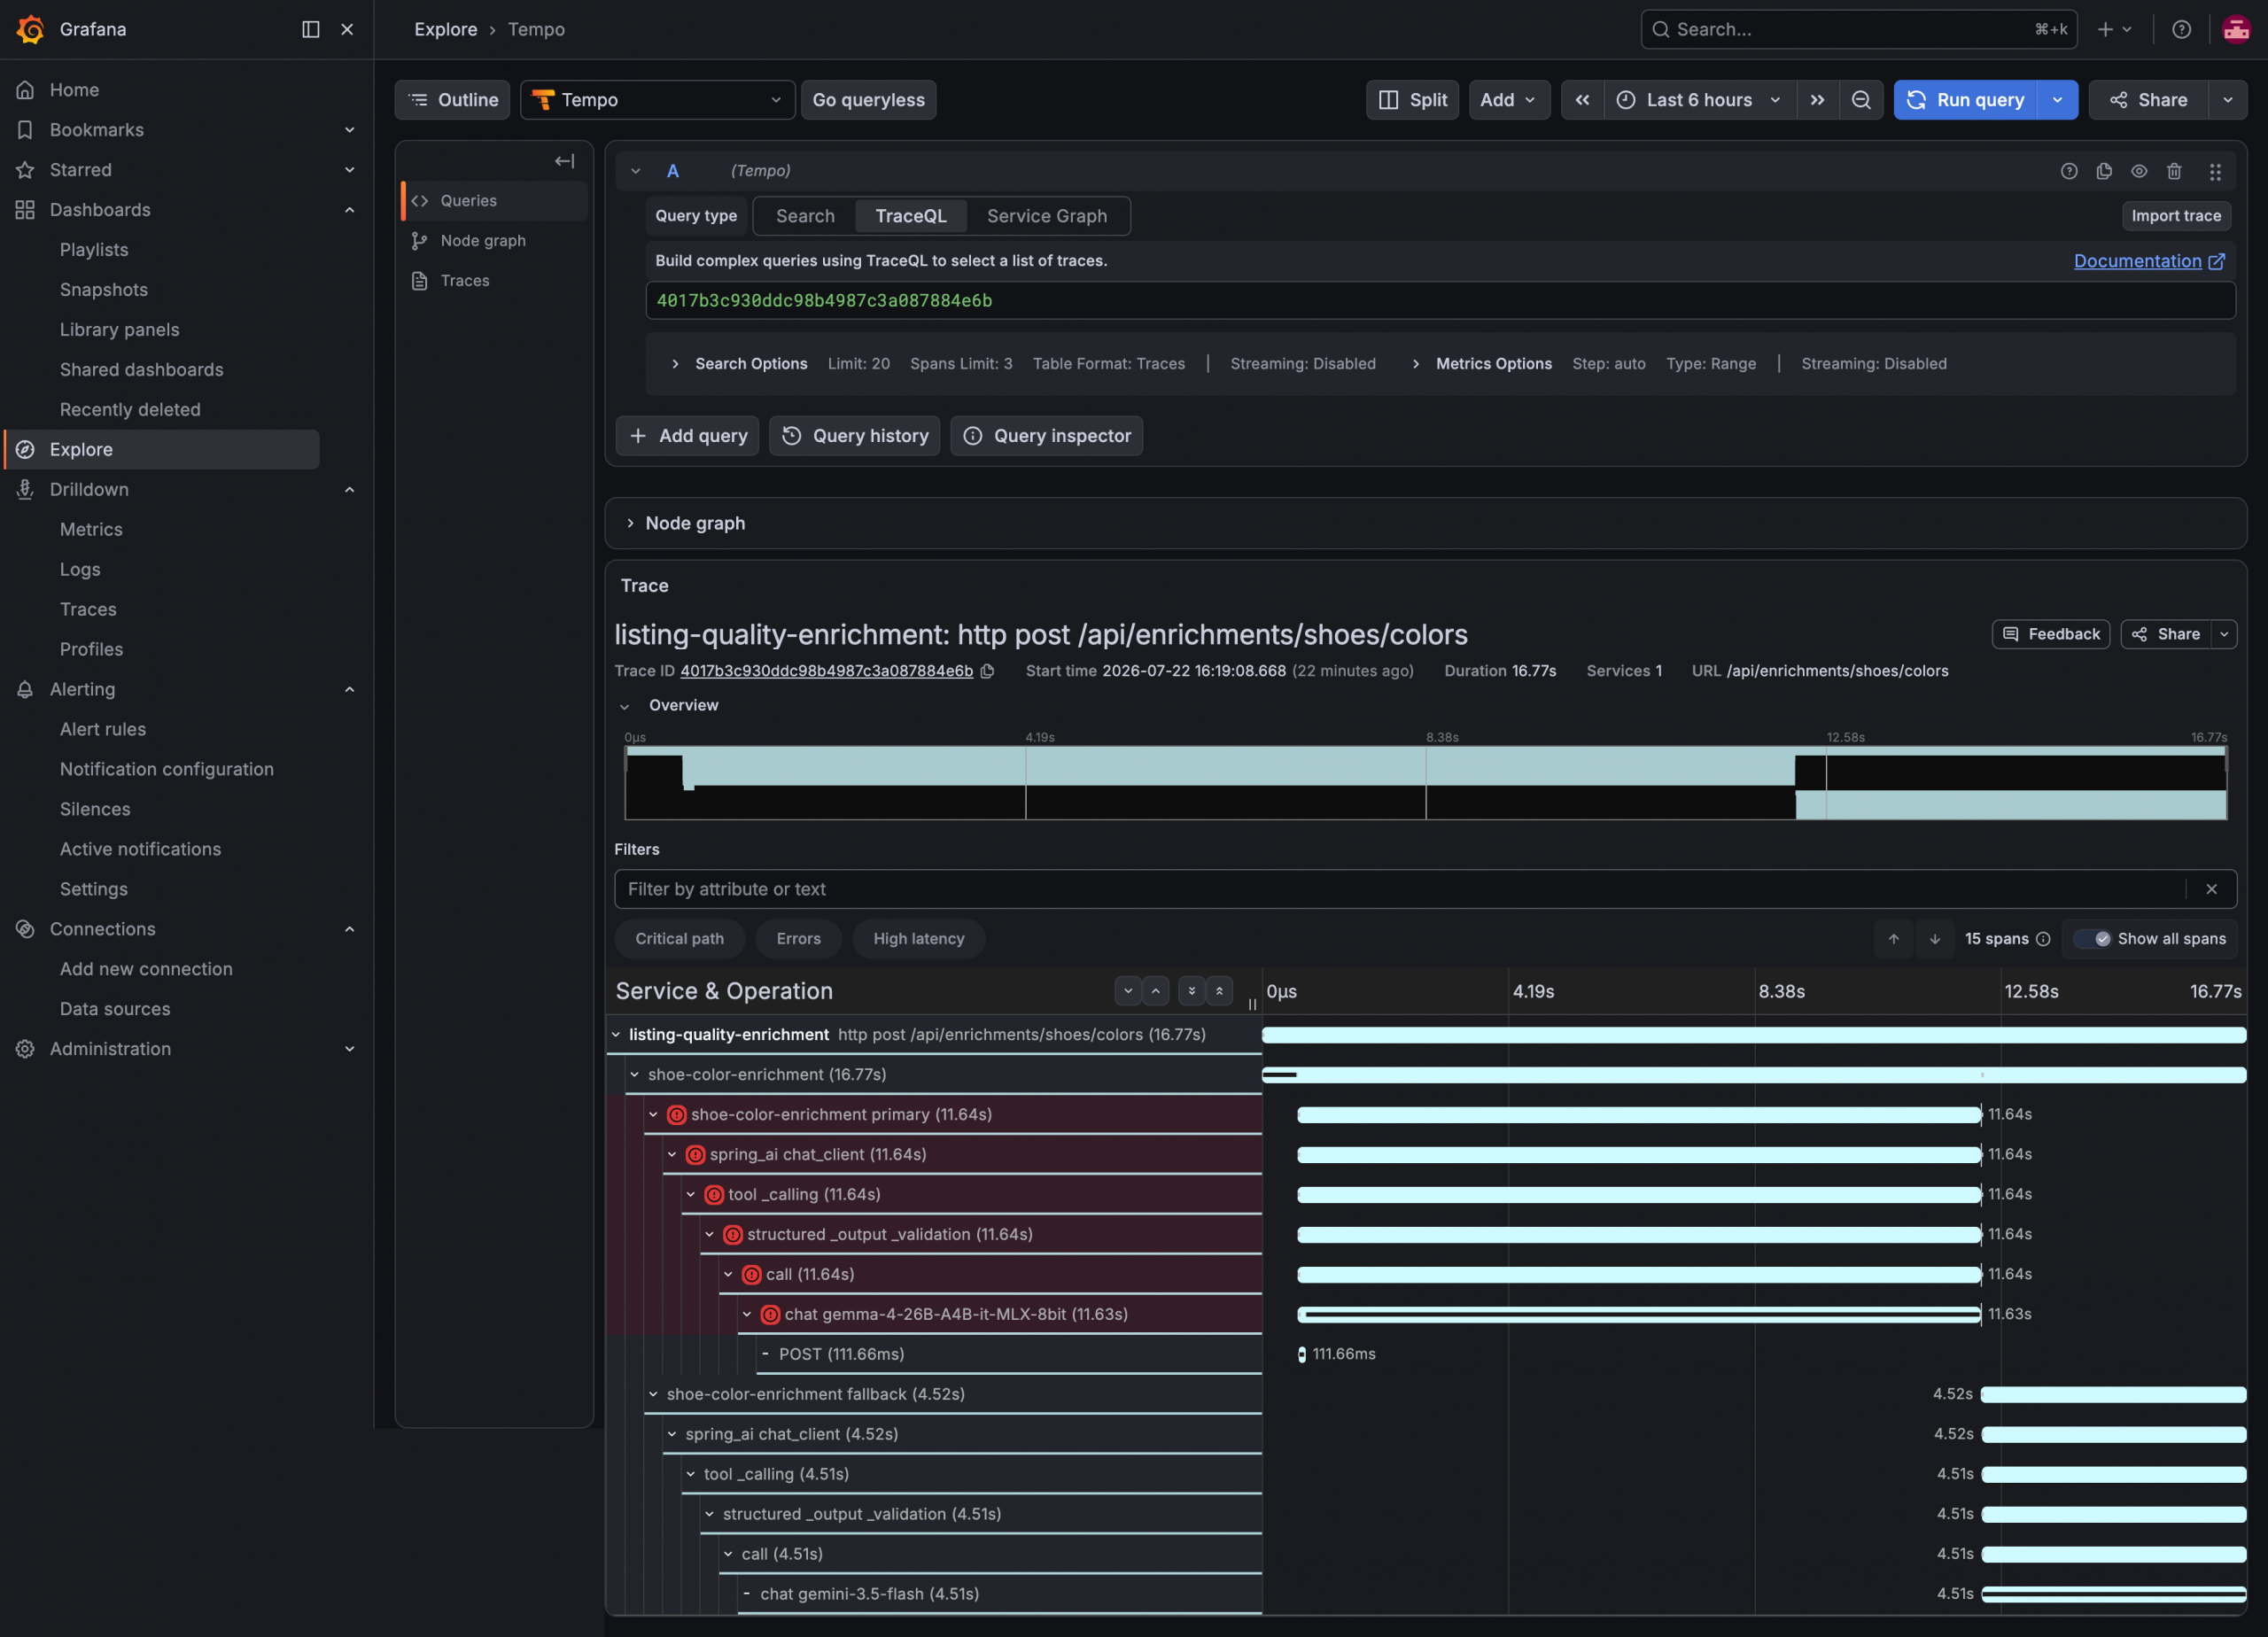 The primary route span is marked as an error, and the outbound
 POST to the local model server nested inside it returned HTTP 200. That pairing is the argument of this article in one screenshot. The transport succeeded. The model route failed, because the returned colors did not satisfy the evidence rules. The feature succeeded, because the Gemini fallback produced a usable result. Three levels, three different answers, one seller request.
Expanding the primary route span shows result=failure, outcome=invalid_model_output, and provider=omlx. Expanding the fallback shows result=success, outcome=accepted, and provider=gemini. A dashboard alone would have shown a slower request. The trace shows which layer decided what.
The Tempo data source enables the node graph view. I intentionally left out Grafana’s service-map integration because it requires Tempo metrics-generator output, which this small local stack does not run.
Estimate cost, but do not pretend it is billing
Spring AI token counters let us build a useful operational estimate. They do not replace the provider invoice.
The recording rules carry a price snapshot dated July 21, 2026. Based on the official Gemini API pricing page, the checked-in rules use USD 1.50 per million input tokens and USD 9.00 per million output tokens for Gemini 3.5 Flash:
- record: listing_quality:estimated_cloud_cost_usd_total
  expr: |
    gen_ai_client_token_usage_total{
      gen_ai_request_model=~"gemini-3\\.5-flash.*",
      gen_ai_token_type="input"
    } * 1.50 / 1000000
  labels:
    charge_type: input
    price_snapshot: "2026-07-21"
    pricing_model: gemini-3.5-flash

- record: listing_quality:estimated_cloud_cost_usd_total
  expr: |
    gen_ai_client_token_usage_total{
      gen_ai_request_model=~"gemini-3\\.5-flash.*",
      gen_ai_token_type="output"
    } * 9.00 / 1000000
  labels:
    charge_type: output
    price_snapshot: "2026-07-21"
    pricing_model: gemini-3.5-flash
Based on the official GPT-5.4 mini model page, the same file includes GPT-5.4 mini at USD 0.75 per million input tokens and USD 4.50 per million output tokens.
These values exclude cached-input discounts, account contracts, tool fees, taxes, and provider billing reconciliation. A production finance report should reconcile against provider billing exports.
Local inference has no provider token fee, but it is not free. Hardware, electricity, capacity, monitoring, upgrades, latency, and engineering time still exist. The dashboard therefore leaves local-model cost unpriced rather than assigning a misleading zero total cost.
Turn the metrics into example SLOs
The repository includes educational recording and alerting rules for:
- valid feature-result ratio
- p95 end-to-end feature latency
- fallback ratio
- both application scrape targets being available
For example, the valid-result alert requires a sustained ratio below 99 percent for ten minutes:
- alert: ListingQualityFeatureFailureRatioHigh
  expr: listing_quality:feature_valid_result_ratio_5m < 0.99
  for: 10m
  labels:
    severity: warning
  annotations:
    summary: "Feature valid-result ratio is below the example objective"
This is not a production recommendation. An SLO must come from product impact, real traffic, and an agreed error budget.
I would usually define at least two objectives for these features:
- Reliability: the percentage of requests that return a safe, structurally valid domain response.
- Latency: the percentage of complete feature requests below a category-specific threshold.
I would track fallback ratio as a diagnostic or supporting indicator, not automatically as an SLO violation. A fallback can preserve the user outcome. But a rising ratio usually predicts more latency, more cloud cost, or a failing primary route.
Seller-input outcomes deserve a separate product metric. They are technically valid, but a high rate may mean the feature is not useful enough. Mixing them with system failures would hide both problems.
Test telemetry like application code
The automated suite remains offline and deterministic. It does not call a model, Google Books, Prometheus, Tempo, or Grafana.
The unit tests use SimpleMeterRegistry with DefaultMeterObservationHandler to verify:
- one feature timer per use-case execution
- primary and fallback route tags
- bounded success and failure outcomes
- one fallback counter at the decision point
- route-failure categories
- retry and circuit-breaker meters
- virtual-thread context propagation
- the absence of seller data and exception messages in labels
- route observations around provider execution and application validation
- Google Books URL query redaction
Two startup tests guard the configuration split. One boots each application without the observability profile and asserts that the Prometheus registry exists, the endpoint is exposed, and no exporter is enabled. The other activates the profile and asserts that trace export is configured. Both assert that prompt and completion logging remain false, without supplying false as the assertion default, so deleting those lines fails the test instead of silently passing.
The complete reactor runs offline:
./mvnw -o testThe backend files have their own validation path:
docker compose -f observability/compose.yaml config

docker run --rm \
  --entrypoint=/bin/promtool \
  -v "$PWD/observability/prometheus:/etc/prometheus:ro" \
  prom/prometheus:v3.12.0 \
  check config /etc/prometheus/prometheus.yml
I also started the three pinned containers and both Spring Boot applications. Prometheus reported both targets as healthy. Tempo received traces from both services. Grafana provisioned both data sources and a 12-panel dashboard. Every dashboard PromQL expression parsed against Prometheus, and the raw feature and model histograms stored exemplars linked to Tempo. A scan of both metrics payloads and fresh traces found no representative listing IDs, titles, image URLs, prompts, query strings, or keys.
What changes for production
The local stack is complete enough to run and inspect, but it is intentionally not a production platform.
For production, I would add:
- a separate authenticated management port or network
- TLS between telemetry components
- an OpenTelemetry Collector between applications and the backend
- tail or probabilistic sampling appropriate to traffic
- persistent object storage for traces
- Prometheus high availability or a managed metrics backend
- Alertmanager routing and ownership
- retention and capacity planning
- access controls for Grafana and Tempo
- billing reconciliation outside Prometheus
- explicit telemetry schema ownership and cardinality budgets
The Collector is a deliberate omission from this tutorial. For two local applications, direct OTLP export makes the data path easier to understand. In production, a Collector gives us buffering, retries, routing, redaction, sampling, and backend independence without putting those policies in every service.
Final thoughts
Adding a dashboard is not the same as making an AI feature observable.
The useful design starts earlier:
- define what a valid feature result means
- measure the complete use case, not only the provider call
- keep model telemetry in Spring AI
- count retry and fallback as different events
- preserve context across asynchronous and virtual-thread boundaries
- treat labels as a bounded API
- sanitize outbound HTTP observation URLs
- estimate cost with dated assumptions
- verify privacy and trace quality in a live stack
The main benefit is not another graph. It is being able to answer a production question by moving from a business outcome, to a route decision, to a model call, to the relevant trace without guessing from unrelated logs.
That is the point where the Spring AI examples in this series start to behave like operable services rather than isolated model demos.